Aplicação
Para a aplicação será reproduzido o exemplo do TBEP R Training. Para isso, serão instalados os pacotes sf e mapview.
options(repos = list(CRAN="http://cran.rstudio.com/"))
options("install.lock"=FALSE)
install.packages(c('sf','mapview'))
library(sf)
library(mapview)
library(ggplot2)
install.packages("tidyverse")
#library(tidyverse)O shapefile “sgdat.shp” são dados da cobertura de algas marinhas em Tampa Bay em 2016. As “features” são as linhas do vetor e os “fields” são as colunas, ou melhor, atributos (“OBJECT ID” e “FLUCCS”). O SGR do arquivo é WGS 84. A coluna “geometry” armazena os dados espaciais (longitude e latitude).
Esse é o passo a passo de como importar um shapefile. Porém, muitas vezes não possuímos um shapefile e queremos criar um a partir de um dataframe. Para isso, é necessário que o dataframe inclua as coordenadas geográficas (longitude e latitude) e que tenhamos conhecimento do SGR. O dataframe ´fishdat´ possui as características dos peixes encontrados e o statloc apresenta a localização deles. O passo a passo será realizado abaixo.
# dados da presença de peixes em Tampa Bay
fishdat <- read.csv("Data/fishdat.csv")
#localização geográfica dos peixes
statloc <- read.csv("Data/statloc.csv")# estrutura dos dados
str(fishdat)## 'data.frame': 2844 obs. of 12 variables:
## $ OBJECTID : int 1550020 1550749 1550750 1550762 1550828 1550838 1550842 1551131 1551311 1551335 ...
## $ Reference : chr "TBM1996032006" "TBM1996032004" "TBM1996032004" "TBM1996032207" ...
## $ Sampling_Date: chr "1996-03-20" "1996-03-20" "1996-03-20" "1996-03-22" ...
## $ yr : int 1996 1996 1996 1996 1996 1996 1996 1996 1996 1996 ...
## $ Gear : int 300 22 22 20 160 300 300 300 300 22 ...
## $ ExDate : chr "2018-04-12 10:27:38" "2018-04-12 10:25:23" "2018-04-12 10:25:23" "2018-04-12 10:25:23" ...
## $ Bluefish : int 0 0 0 0 0 0 0 0 0 0 ...
## $ Common.Snook : int 0 0 0 0 0 0 0 0 0 0 ...
## $ Mullets : int 0 0 0 0 0 0 0 0 0 0 ...
## $ Pinfish : int 0 54 0 80 0 0 0 0 1 1 ...
## $ Red.Drum : int 0 0 1 0 4 0 0 0 0 0 ...
## $ Sand.Seatrout: int 1 0 0 0 0 1 5 66 0 0 ...str(statloc)## 'data.frame': 2173 obs. of 3 variables:
## $ Reference: chr "TBM1996032006" "TBM1996032004" "TBM1996032207" "TBM1996042601" ...
## $ Latitude : num 27.9 27.9 27.9 28 27.9 ...
## $ Longitude: num -82.6 -82.6 -82.5 -82.7 -82.6 ...Para isso, utilizaremos a função st_as_sf() para transformar o dataframe em um objeto sf. Primeiramente, precisamos juntar os dois datasets (fishdat e statloc) e dizer qual coluna que possui os dados da geometria (latitude e longitude). Além disso, é necessário dizer qual o SGR e, além disso, precisamos garantir que ambos datasets possuam o mesmo SGR. Por enquanto, podemos fazer um “chute calibrado” que é o WGS84.
#juntando os dois dataframes
library(dplyr)
joindata <- left_join(fishdat,statloc,by="Reference")
#criando o objeto de dados espaciais
joindata <- st_as_sf(joindata, coords=c('Longitude','Latitude'), crs = st_crs(sgdat))
#tipo de objeto sf
str(joindata)## Classes 'sf' and 'data.frame': 2844 obs. of 13 variables:
## $ OBJECTID : int 1550020 1550749 1550750 1550762 1550828 1550838 1550842 1551131 1551311 1551335 ...
## $ Reference : chr "TBM1996032006" "TBM1996032004" "TBM1996032004" "TBM1996032207" ...
## $ Sampling_Date: chr "1996-03-20" "1996-03-20" "1996-03-20" "1996-03-22" ...
## $ yr : int 1996 1996 1996 1996 1996 1996 1996 1996 1996 1996 ...
## $ Gear : int 300 22 22 20 160 300 300 300 300 22 ...
## $ ExDate : chr "2018-04-12 10:27:38" "2018-04-12 10:25:23" "2018-04-12 10:25:23" "2018-04-12 10:25:23" ...
## $ Bluefish : int 0 0 0 0 0 0 0 0 0 0 ...
## $ Common.Snook : int 0 0 0 0 0 0 0 0 0 0 ...
## $ Mullets : int 0 0 0 0 0 0 0 0 0 0 ...
## $ Pinfish : int 0 54 0 80 0 0 0 0 1 1 ...
## $ Red.Drum : int 0 0 1 0 4 0 0 0 0 0 ...
## $ Sand.Seatrout: int 1 0 0 0 0 1 5 66 0 0 ...
## $ geometry :sfc_POINT of length 2844; first list element: 'XY' num -82.6 27.9
## - attr(*, "sf_column")= chr "geometry"
## - attr(*, "agr")= Factor w/ 3 levels "constant","aggregate",..: NA NA NA NA NA NA NA NA NA NA ...
## ..- attr(*, "names")= chr [1:12] "OBJECTID" "Reference" "Sampling_Date" "yr" ...#checando SGR
st_crs(joindata)## Coordinate Reference System:
## User input: WGS 84
## wkt:
## GEOGCRS["WGS 84",
## DATUM["World Geodetic System 1984",
## ELLIPSOID["WGS 84",6378137,298.257223563,
## LENGTHUNIT["metre",1]]],
## PRIMEM["Greenwich",0,
## ANGLEUNIT["degree",0.0174532925199433]],
## CS[ellipsoidal,2],
## AXIS["latitude",north,
## ORDER[1],
## ANGLEUNIT["degree",0.0174532925199433]],
## AXIS["longitude",east,
## ORDER[2],
## ANGLEUNIT["degree",0.0174532925199433]],
## ID["EPSG",4326]]st_crs(sgdat) ## Coordinate Reference System:
## User input: WGS 84
## wkt:
## GEOGCRS["WGS 84",
## DATUM["World Geodetic System 1984",
## ELLIPSOID["WGS 84",6378137,298.257223563,
## LENGTHUNIT["metre",1]]],
## PRIMEM["Greenwich",0,
## ANGLEUNIT["degree",0.0174532925199433]],
## CS[ellipsoidal,2],
## AXIS["latitude",north,
## ORDER[1],
## ANGLEUNIT["degree",0.0174532925199433]],
## AXIS["longitude",east,
## ORDER[2],
## ANGLEUNIT["degree",0.0174532925199433]],
## ID["EPSG",4326]]Caso seja necessário modificar a projeção, utiliza-se a função `st_transform(). Nesse caso, não precisamos modificar já que o shapefile (sgdat) tem o mesmo SGR do que estamo querendo criar.
Agora, iniciaremos a análise geoespacial dos dados. Inicialmente, iremos dar uma olhada geral para entender qual os dados que estamos lidando.
O padrão é que a função ´plot()´ plote todas as feições. Para plotar somente a geometria, utiliza-se st_geometry().
plot(st_geometry(joindata)) 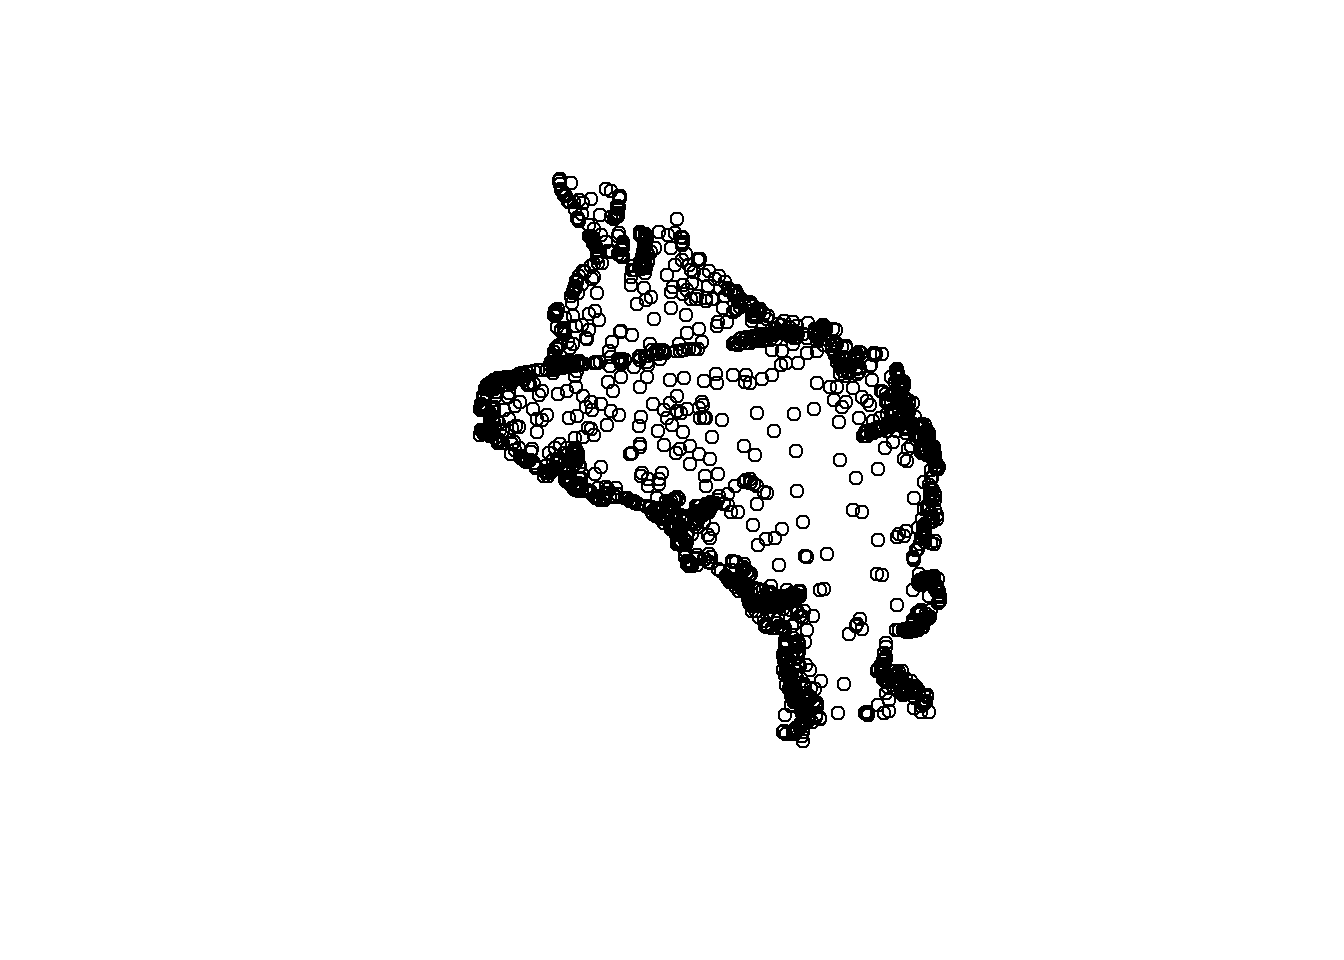
plot(joindata)
plot(sgdat)
Conforme observamos o shapefile “sgdat” com os dados das algas marinhas e o “joindata” com os dados do posicionamento de peixes, é possível verificar que existem áreas de intersecção entre ambos. Para analisar novamente, iremos plotar somente a geometria de ambos:
plot(joindata$geometry)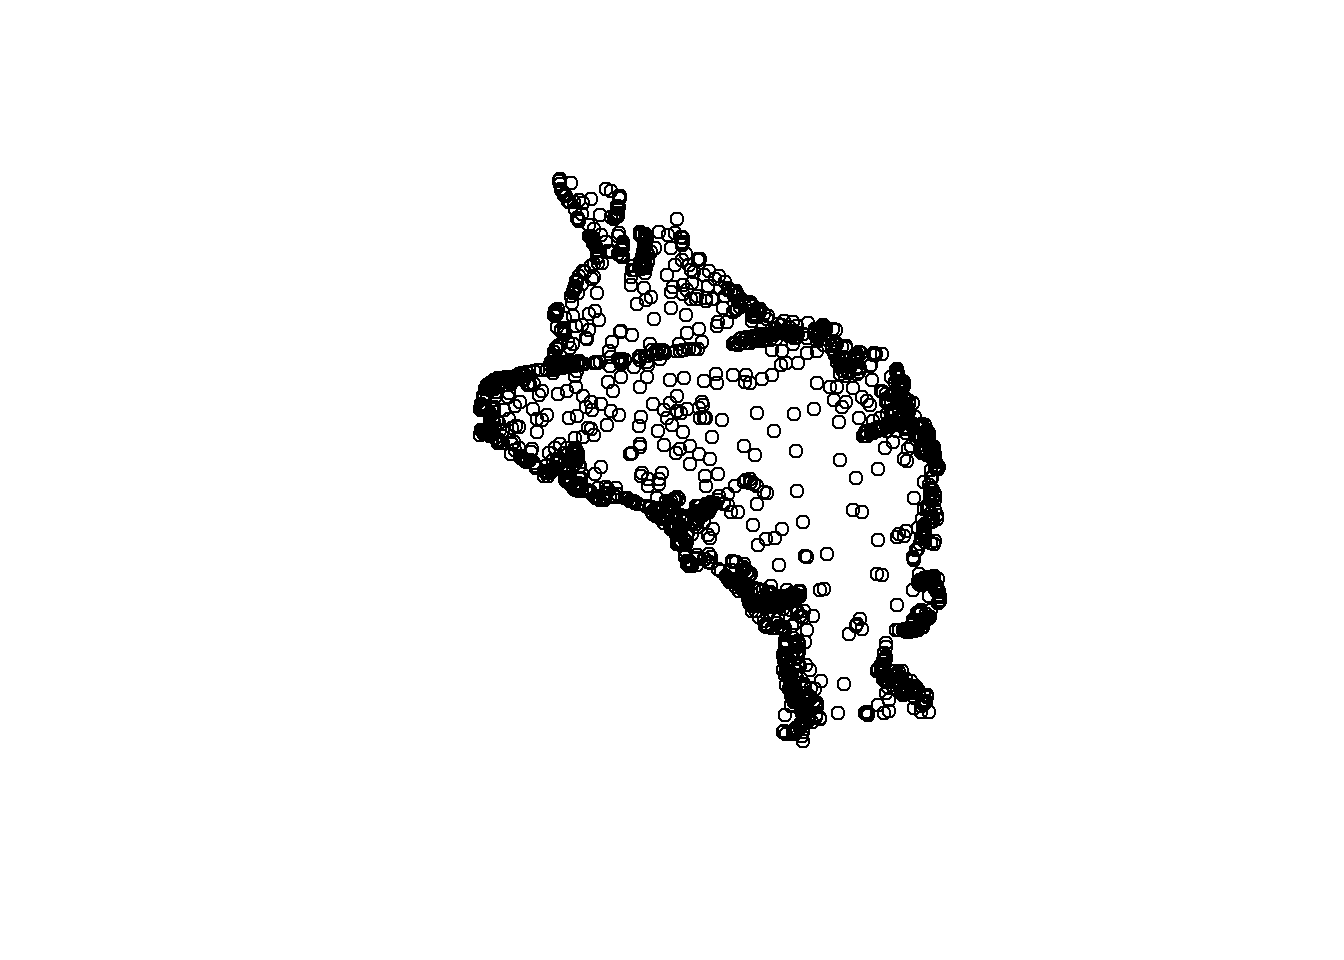
plot(sgdat$geometry)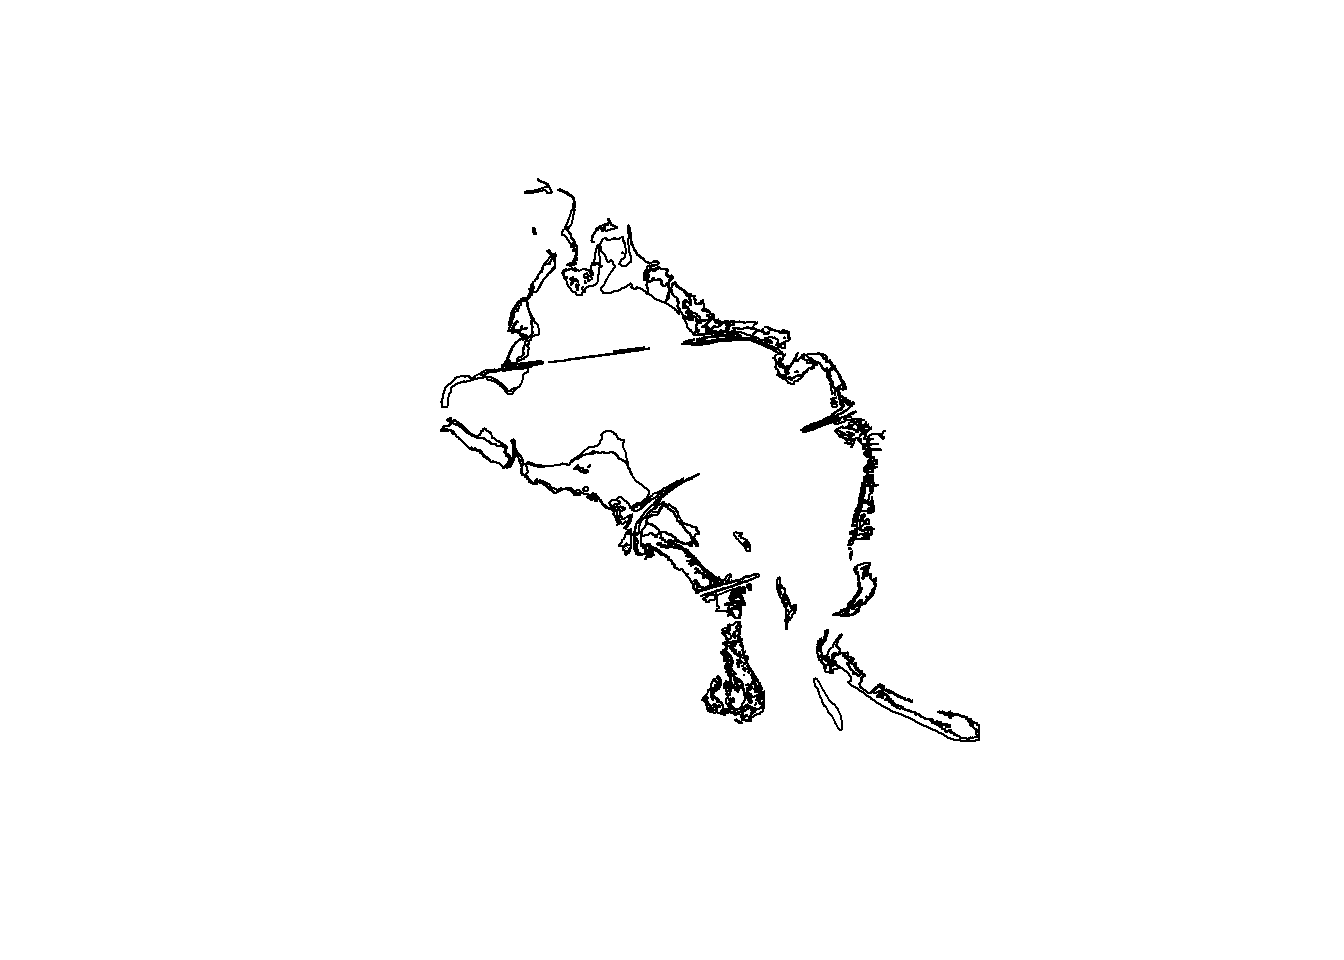
Vamos filtrar somente os dados dos peixes do ano de 2016:
filt_data <- joindata %>%
filter(yr == 2016)
plot(st_geometry(filt_data))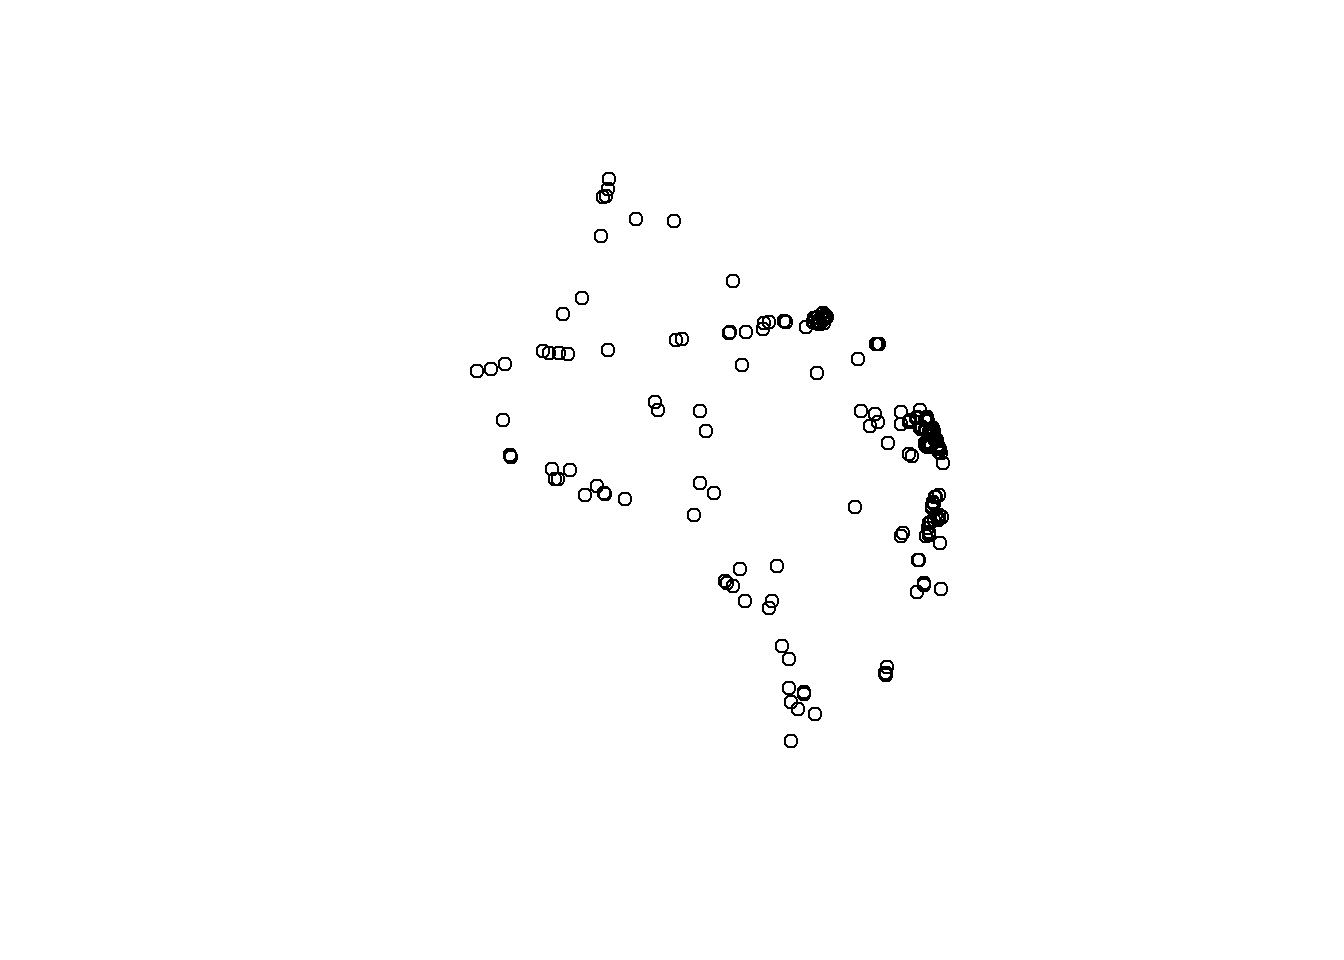
Agora, verificaremos quantos peixes foram vistos nos mesmos locais em que encontraram-se algas marinhas em 2016. Ou seja, iremos selecionar as localizações que possuem ambos dados. Para isso, iremos utilizar o código abaixo:
fish_crop <- filt_data[sgdat, ]
plot(fish_crop$geometry)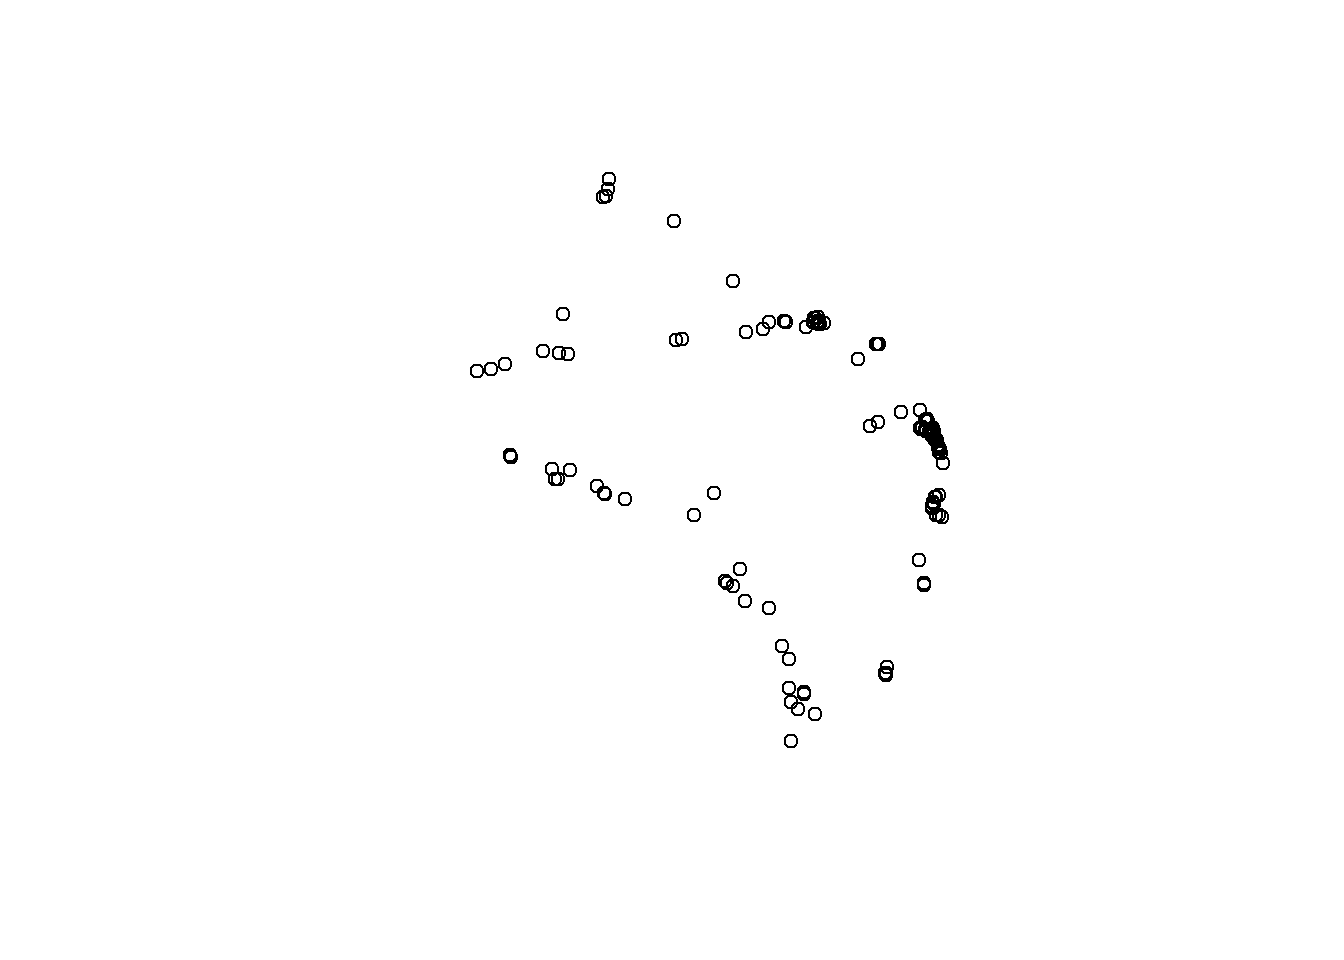 O que foi realizado até agora é somente a intersecção da geometria de ambos datasets. Portanto, agora realizaremos a intersecção de ambos dados, incluindo atributos:
fish_int <- st_intersection(filt_data, sgdat)
plot(st_geometry(fish_int))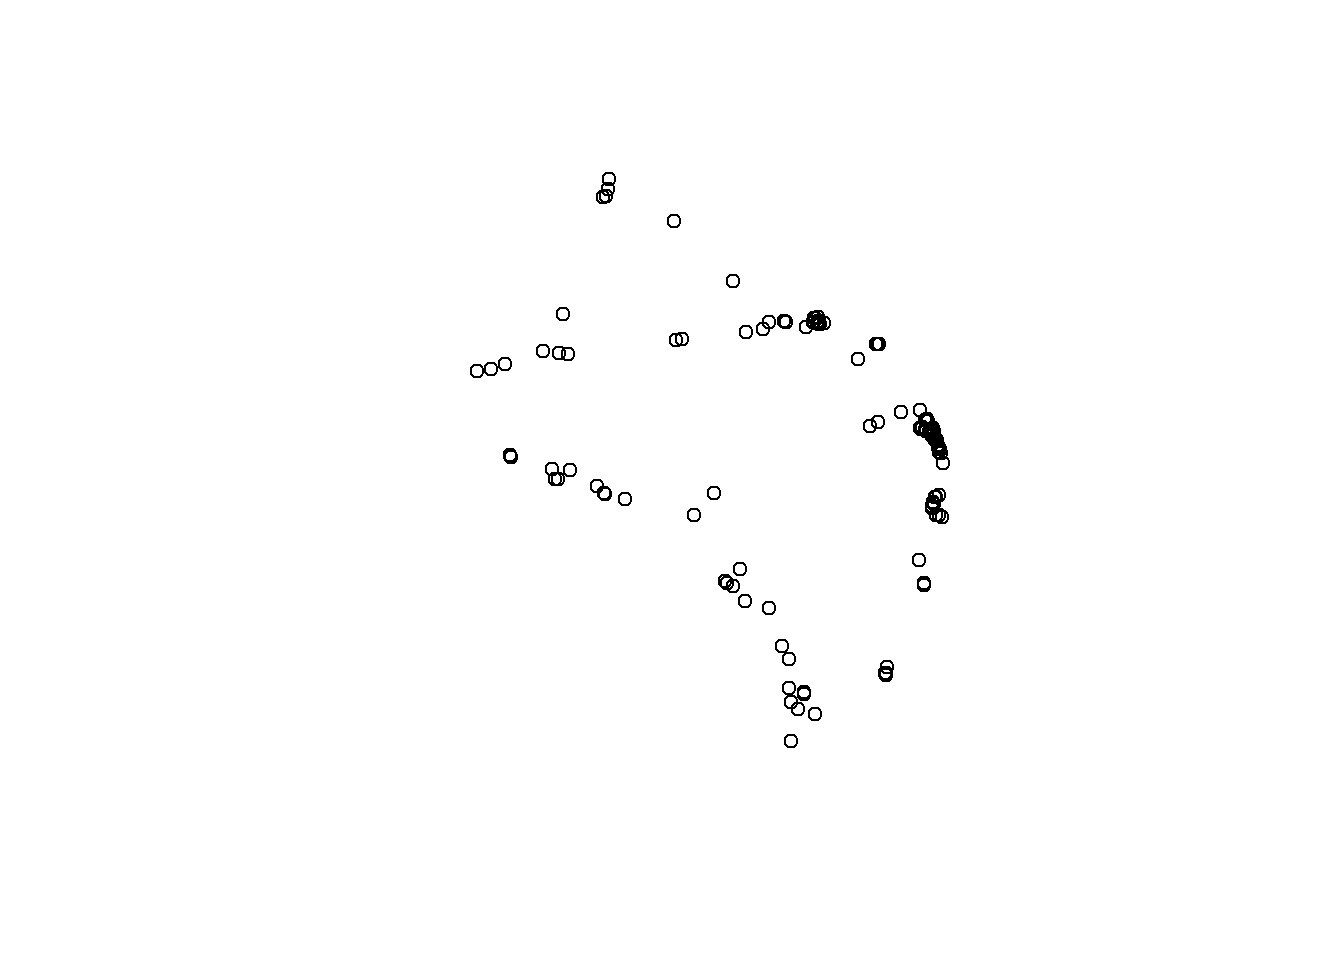
View(fish_int)É possível utilizar ferramentas do tidyverse. Abaixo, iremos fazer a soma de todos os Pinfish foram pegos em 2016:
fish_cnt <- fish_int %>%
group_by(FLUCCS) %>%
summarise(
cnt = sum(Pinfish)
)
fish_cnt## Simple feature collection with 2 features and 2 fields
## Geometry type: MULTIPOINT
## Dimension: XY
## Bounding box: xmin: -82.7182 ymin: 27.82623 xmax: -82.53237 ymax: 28.02418
## Geodetic CRS: WGS 84
## # A tibble: 2 × 3
## FLUCCS cnt geometry
## <chr> <int> <MULTIPOINT [°]>
## 1 9113 1559 ((-82.53352 27.92907), (-82.53617 27.91043), (-82.53535 27.91212…
## 2 9116 4766 ((-82.55893 27.96612), (-82.5588 27.96633), (-82.55797 27.96632)…Além de realizar a soma nos atributos numéricos (quantidade de Pinfish), também é realizada nos atributos geométricos (latitude e longitude). Conforme apresentado na tabela anterior, existe uma maior quantidade de Pinfishs em áreas onde existe maior quantidade de algas marinhas (FLUCCS=9116). É possível realizar um gráfico em relação às duas categorias de cobertura de algas marinhas (´9113´: desigual, ´9116´: contínua).
ggplot(fish_cnt, aes(x = FLUCCS, y = cnt)) +
geom_bar(stat = 'identity', fill='navyblue') 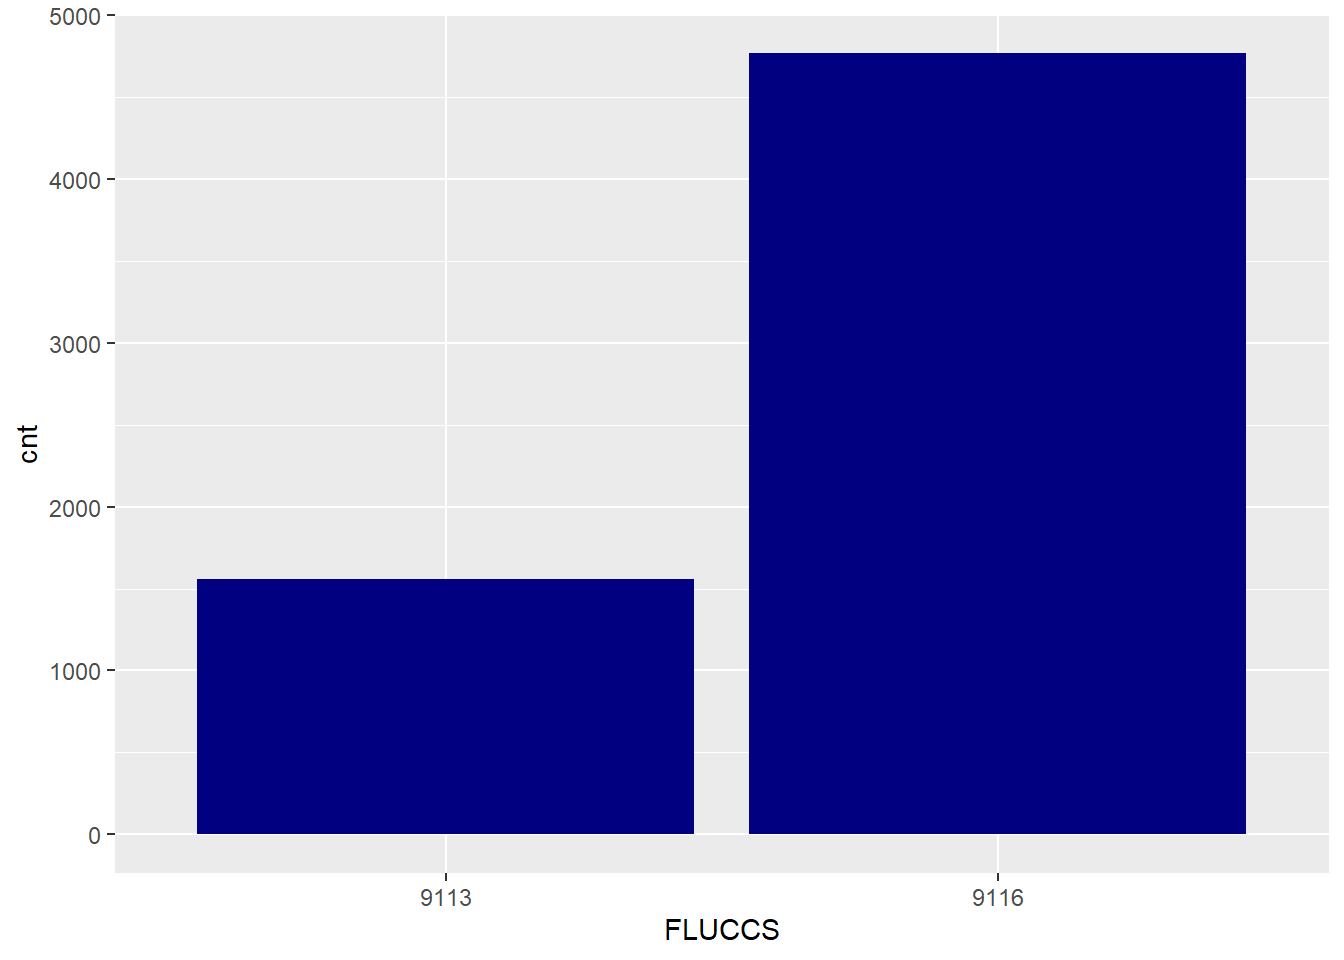 Agora será realizada a confecção de mapas. Utilizaremos os pacotes
 ggplot2 inicialmente:
ggplot() +
geom_sf(data = sgdat, fill = 'green') +
geom_sf(data = joindata) 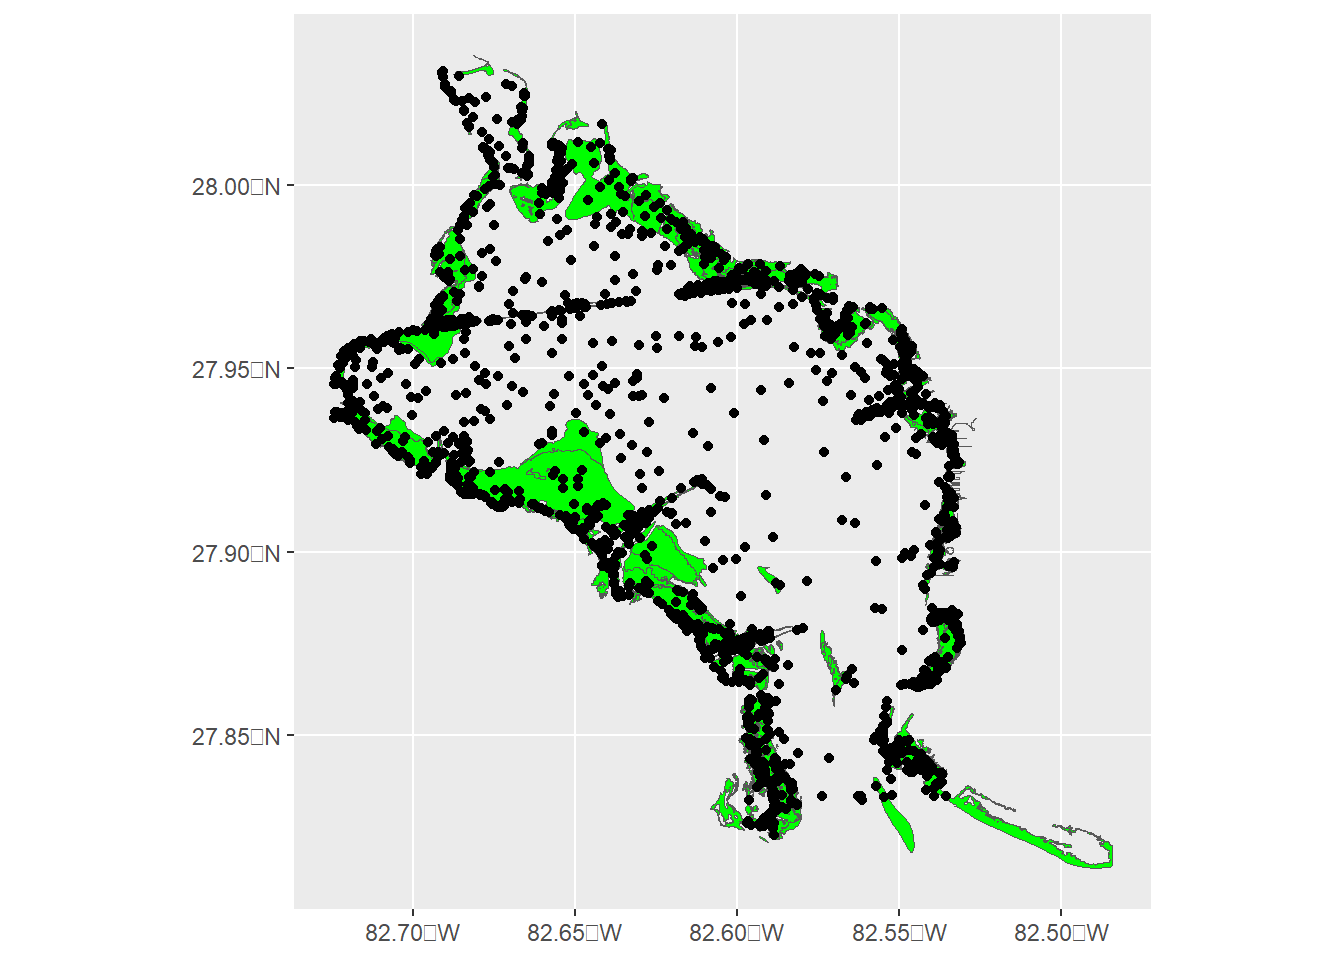 Agora, para criar um mapa interativo para selecionar e dar zoom nos dados, utilizaremos o pacote
 mapview:
mapview(sgdat, col.regions = 'green') +
mapview(joindata, zcol = 'Gear')